 TabTasker
TL;DR:
- Chrome DevTools is a local-first browser inspection tool that allows direct editing and saving of page files without uploads or accounts. It offers panels like Elements, Network, and Sources for tasks such as resource saving, CSS tweaking, and persistent editing, while maintaining user privacy by running entirely on your device. For tasks like batch image edits or PDF modifications, no-code tools like Tabtasker provide local processing without requiring sign-in or file uploads.
Chrome DevTools is a built-in, local-first inspection suite that lets you examine, edit, and save page files and media directly in your browser — no uploads, no account required. Open it right now by right-clicking any page element and selecting Inspect, or press Ctrl+Shift+I on Windows/Linux or Cmd+Option+I on macOS. Three tools worth knowing from the start: Chrome DevTools for inspection and debugging, Lighthouse for local performance audits, and Tabtasker for no-code, point-and-click file editing when DevTools feels like too much.
- Chrome DevTools: built into every Chrome install, zero setup
- Lighthouse: audits performance, accessibility, and SEO locally inside DevTools
- Tabtasker: a no-code, local-first alternative for editing images, audio, and PDFs without touching code
Table of Contents
- How to open Chrome developer tools in under 30 seconds
- Which panel should you actually use?
- Practical local workflows for inspecting and saving files
- Three quick examples you can try right now
- Why DevTools is private by default
- Shortcuts and UX tweaks that save real time
- What DevTools cannot do for non-developers
- Useful resources to go deeper
- Key takeaways
- When DevTools is the right call — and when it isn't
- Tabtasker: local-first file editing without the code
How to open Chrome developer tools in under 30 seconds
Three entry points get you in fast. Right-click any element on a page and choose Inspect — Chrome opens the Elements panel pointed directly at that node. From the Chrome menu, go to More tools → Developer tools. Or use a keyboard shortcut and skip the mouse entirely.
| Action | Windows / Linux | macOS |
|---|---|---|
| Open DevTools (last panel) | Ctrl+Shift+I | Cmd+Option+I |
| Open Elements panel | Ctrl+Shift+C | Cmd+Shift+C |
| Open Console panel | Ctrl+Shift+J | Cmd+Option+J |
| Command Menu | Ctrl+Shift+P | Cmd+Shift+P |
| Hard reload | Ctrl+Shift+R | Cmd+Shift+R |
Shortcuts come straight from the official DevTools open guide, which also covers the three reload options available when DevTools is active.
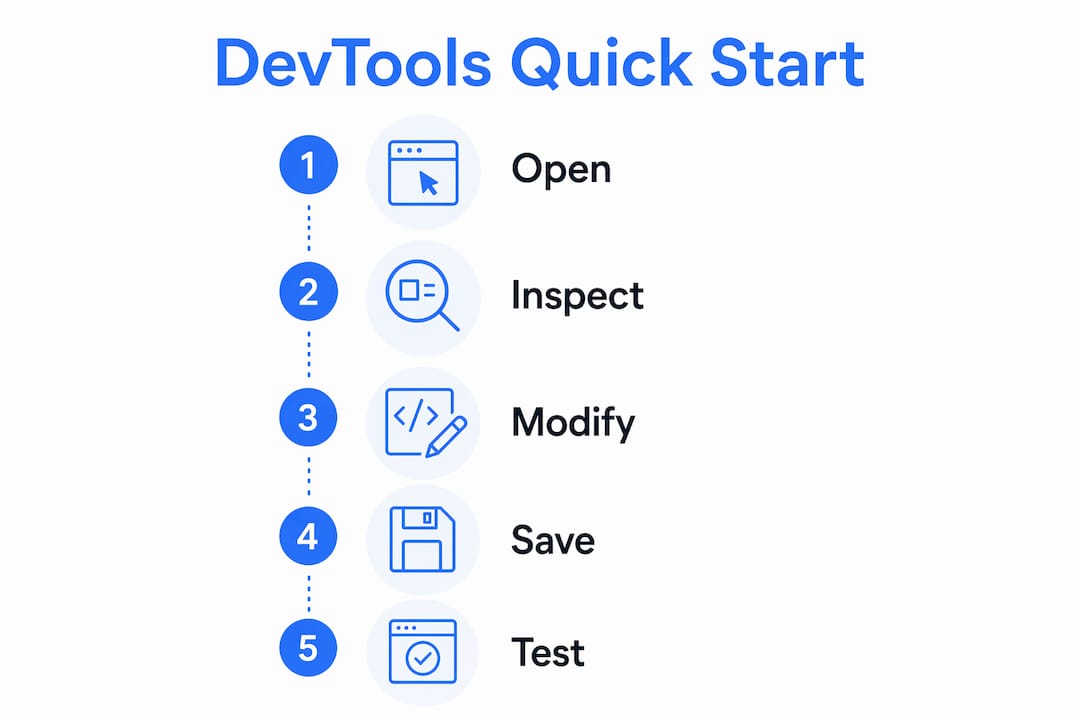
Pro Tip: Dock DevTools to the right side of the screen when testing responsive layouts — it keeps the page viewport narrow without opening a second window. Change the dock position via the three-dot menu in the DevTools toolbar.
Which panel should you actually use?
Practitioners recommend learning one panel deeply rather than skimming all of them. Here is what each main panel does and when to reach for it:
- Elements: Inspect and edit HTML and CSS live. Use it to find an image's
srcattribute, tweak a layout, or test a color change without touching the source file. - Console: Run JavaScript snippets on the fly. Useful for extracting blob URLs or quickly querying the DOM for media elements.
- Sources: Browse and edit page scripts and stylesheets. The Workspace feature maps local files so edits persist to disk.
- Network: See every request the page makes, including images, audio, and video. Export the full session as a HAR file for offline review.
- Performance: Record a timeline of rendering, scripting, and painting. Reach for it when a page feels slow or a media asset is blocking render.
- Memory: Profile heap usage. Relevant when a video player or canvas element is leaking memory.
- Application: Inspect cookies, localStorage, IndexedDB, and cached assets. Useful for clearing sensitive data stored by a page.
- Security: Check TLS certificate details and mixed-content warnings for any resource the page loads.
- Lighthouse / Recorder: Lighthouse runs locally inside DevTools to audit performance, accessibility, and SEO without sending page data to external servers.
For file and media work, the panels you will use most are Network (saving resources), Elements (finding image URLs), and Sources (persisting edits).
Practical local workflows for inspecting and saving files
These three workflows keep everything on your machine. No file leaves your device.
Workflow 1: Save an image or video from a page
- Open DevTools and click the Network tab.
- Reload the page (
Ctrl+R/Cmd+R) so the panel captures all requests. - Filter by Img or Media using the type buttons in the toolbar.
- Click the resource you want. In the Preview or Response tab, right-click the image and choose Save image as, or copy the request URL and open it in a new tab to download.
Workflow 2: Export network activity to a HAR file
- Open the Network panel and reload the page.
- Reproduce the action you want to capture (play a video, trigger a download).
- Click the Export HAR icon (down-arrow) in the toolbar.
- Save the
.harfile locally. HAR exports capture every request, response header, and payload so you can review media delivery without a live connection to the original server.
Workflow 3: Test CSS or HTML changes locally
- In the Elements panel, click any element to select it.
- Edit its styles in the Styles pane on the right — changes appear instantly on the page.
- For changes you want to keep, open Sources → Filesystem and add your local project folder. Workspace mapping turns DevTools into a lightweight local editor, saving edits directly to disk.
Pro Tip: Undock DevTools into a separate window (Cmd/Ctrl+Shift+D or the three-dot menu) when comparing a desktop and mobile layout side by side. You can then resize the browser window freely without DevTools eating into the viewport.
Three quick examples you can try right now
Example A: Save an embedded image
- Right-click the image on the page → Inspect. The Elements panel highlights the
<img>tag. - Find the
srcattribute. Copy the URL. - Paste it into a new tab and press Enter. Right-click the image → Save image as to download it locally.
Expected outcome: the image file saves with its original filename or a browser-suggested name, no account needed.
Example B: Inspect and save an audio or video resource
- Open Network, reload the page, and filter by Media.
- Click the audio or video request. Open the Response tab to preview it, or copy the request URL.
- Paste the URL into a new tab and use the browser's native download option.
Expected outcome: a playable local file saved to your downloads folder.
Example C: Quick CSS tweak and local save
- Open Elements, select the element whose style you want to change.
- In the Styles pane, click a property value and type a new one. The page updates live — DevTools lets you edit on-the-fly without touching the original file.
- To persist the change, map the file via Sources → Filesystem and save with
Ctrl+S/Cmd+S.
Verification checklist:
- Change visible in the browser viewport
- Styles pane shows the new value without a strikethrough
- Local file updated (check timestamp in your file manager)
Why DevTools is private by default
DevTools executes its analysis locally inside the Chrome process on your hardware. It does not upload the page content you inspect, the files you examine, or the edits you make to any external server as part of its own operation. That makes it a genuinely local-first tool for sensitive workflows.
A few practices sharpen that privacy posture further:
- Work offline where possible: disconnect from the internet before inspecting a sensitive local file loaded via
file://. - Avoid pasting secrets into Console: anything typed there is visible to anyone with screen access and may persist in Console history.
- Clear Application storage: after reviewing a page that stores tokens or personal data, go to Application → Storage → Clear site data.
- Use a dedicated browser profile: a separate Chrome profile for sensitive work keeps cookies, extensions, and history isolated.
- Watch for extension telemetry: browser extensions can observe network requests even when DevTools is open. For a deeper look at disabling WebRTC and reducing browser-level data exposure, that is a separate but related step worth considering.
For a broader perspective on what privacy-first web apps should look like, the design principles apply equally to the tools you use inside the browser.
Shortcuts and UX tweaks that save real time
- Command Menu (
Ctrl+Shift+P/Cmd+Shift+P): type any panel name or action to jump there instantly — faster than clicking through tabs. - Dock positions: bottom (default), left, right, or separate window. Right-dock suits widescreen monitors; separate window suits dual-monitor setups.
- Device emulation (
Ctrl+Shift+M/Cmd+Shift+M): simulate mobile viewports and touch events without a physical device. - Disable cache: check Disable cache in the Network panel while DevTools is open to prevent stale assets from masking your changes.
- Three reload options: with DevTools open, long-press the reload button for normal reload, hard reload (
Ctrl+Shift+R), or empty cache and hard reload — each progressively more aggressive at clearing cached resources. - Avoid leaving DevTools open during normal browsing: the Disable cache setting stays active while the panel is open, which slows everyday browsing unnecessarily.
What DevTools cannot do for non-developers
DevTools is an inspection and debugging environment, not a point-and-click editor. A few gaps matter if you are not a developer:
- No batch image or audio processing — you inspect one resource at a time.
- No polished PDF viewer or editor — the Application panel shows cached PDFs but offers no editing UI.
- No drag-and-drop background removal, EXIF stripping, or audio trimming.
- The Workspace feature requires manual folder mapping, which is a multi-step setup most non-developers find tedious.
A simple decision rule: use DevTools for inspection, debugging, and quick prototyping. When you need repeated editing, batch processing, or a clean GUI, a no-code local-first tool is the better fit. Tabtasker covers exactly those gaps — background removal, EXIF stripping, audio editing, and PDF tools — all processed in the browser with no uploads or sign-in required.
Useful resources to go deeper
- Chrome DevTools overview: the official starting point; covers every panel with short descriptions and links to deeper guides.
- Open Chrome DevTools: the canonical shortcut reference, including the three reload options.
- Network panel guide: detailed walkthrough of HAR exports, request filtering, and response inspection.
- DebugBear DevTools guide: a practical, task-oriented tutorial that reinforces the single-panel-focus approach.
- In-browser code editors guide: Tabtasker's overview of browser-based editing tools, including how Workspace-style local editing fits into broader workflows.
Pro Tip: Bookmark the Network panel guide specifically if you plan to use HAR exports — it covers edge cases like timing data and redirects that the overview skips.
Key takeaways
Chrome DevTools is the fastest way to inspect, save, and prototype with page files and media locally — and Tabtasker is the no-code alternative when you need a point-and-click editing workflow without uploads.
| Point | Details |
|---|---|
| Open DevTools instantly | Right-click → Inspect, or press Ctrl+Shift+I (Windows/Linux) / Cmd+Option+I (macOS). |
| Focus on one panel | Use Network for saving resources, Elements for CSS/HTML edits, Sources for persisting changes to disk. |
| Privacy is built in | DevTools runs locally inside Chrome and does not upload inspected content to external servers. |
| Know the limits | DevTools is not a batch editor or PDF tool; switch to a no-code local tool for those tasks. |
| Tabtasker fills the gap | For background removal, EXIF stripping, audio editing, and PDF work, Tabtasker processes everything locally with no account required. |
When DevTools is the right call — and when it isn't
Most guides treat Chrome DevTools as an all-purpose power tool. It isn't, and pretending otherwise sets people up for frustration. DevTools excels at one thing: letting you see exactly what a browser is doing with a page, in real time, without sending anything anywhere. For inspecting a suspicious network request, grabbing a media file URL, or testing a CSS change before writing a single line of code, nothing beats it.
Where it falls short is equally clear. If you want to strip EXIF data from a photo, trim an audio clip, or preview a PDF without a developer workflow, DevTools will make you feel like you are using the wrong tool — because you are. That is not a criticism; it is a design boundary. The smarter move is to reach for a no-code, local-first alternative like Tabtasker for those tasks, and keep DevTools for what it was built to do. Knowing which tool fits which job is the real skill here.
Tabtasker: local-first file editing without the code
If DevTools showed you exactly what file you need but editing it requires more than a right-click, Tabtasker is the next step. Every tool runs in your browser, processes files on your device, and asks for nothing — no account, no upload, no waiting.
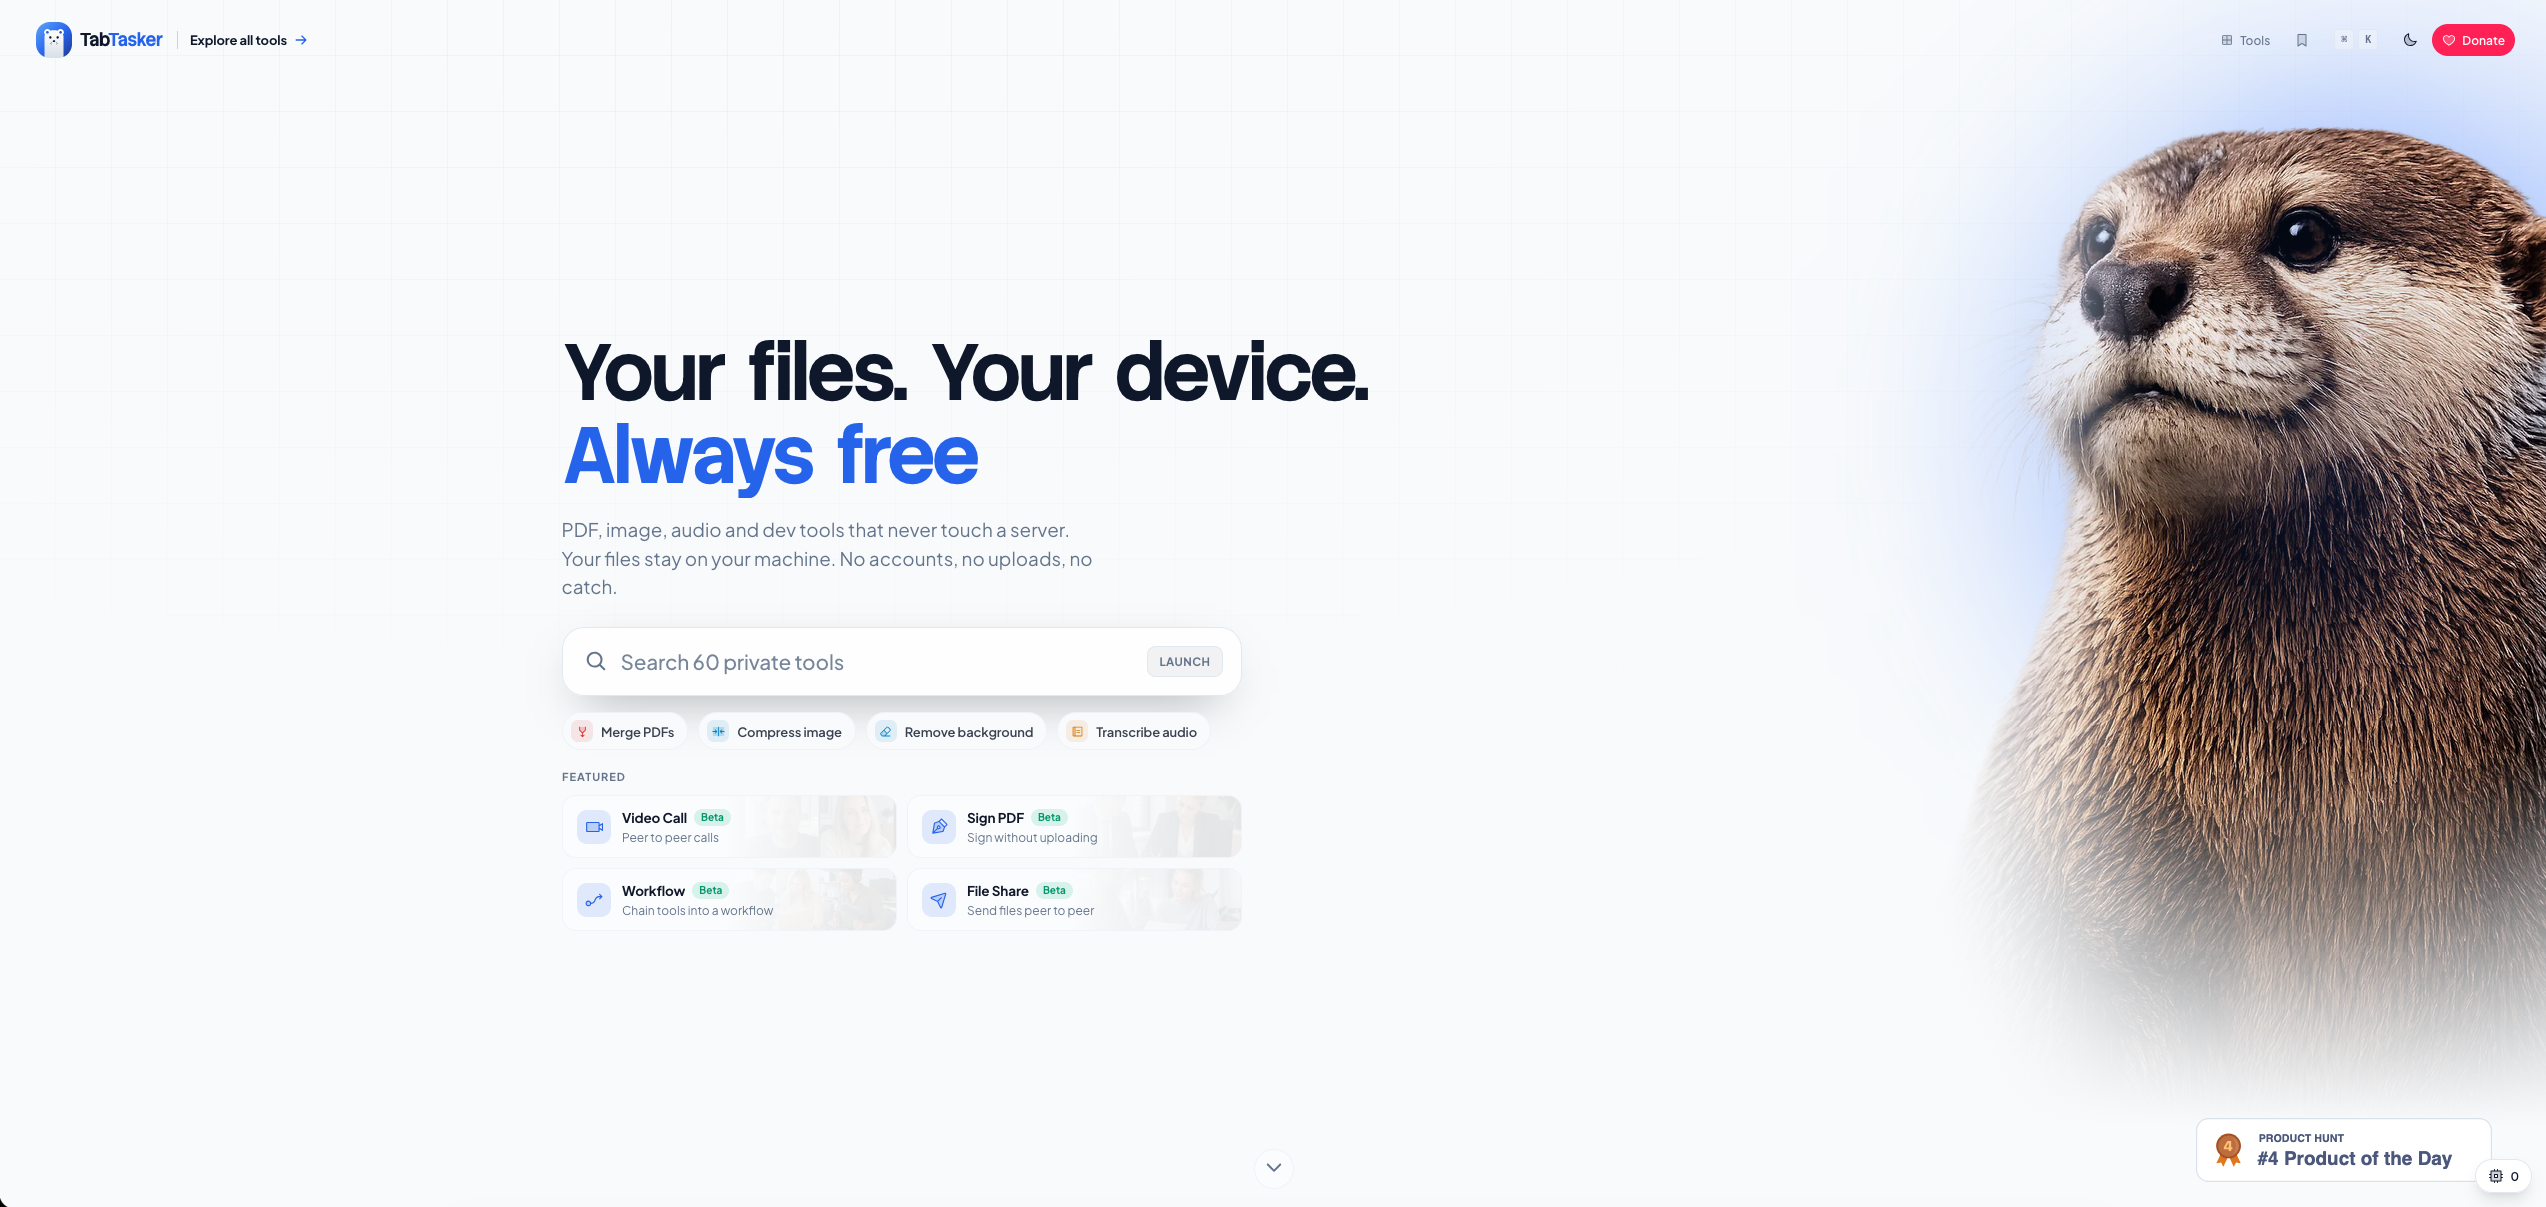
Need to clean up an image? The photo cleanup workflow handles background removal and upscaling in one pass, locally. Working with audio you pulled from a Network panel request? The audio editor lets you trim and adjust it without sending the file anywhere. Tabtasker also covers EXIF stripping, PDF preview, image conversion, and more — the exact tasks DevTools surfaces but cannot finish for non-developers. Visit Tabtasker's full tool suite to find the right tool for your next file task.