 TabTasker
What is the role of browser tools in modern development workflows?
Browser developer tools are the closest thing you have to a live X-ray of your application. They let you inspect and edit HTML, CSS, and JavaScript in real time, monitor network requests with precise timestamps and headers, and observe exactly what the browser renders for an actual user, not what you assumed your code would produce.
Their role goes further than debugging, though. Browser tools support client-side file editing and manipulation entirely within the browser, which means files never leave your device. That single fact has significant privacy implications, especially as more developers question whether uploading files to a third-party server is ever truly "free."
- Live inspection: Edit DOM elements and CSS rules and see changes reflected instantly, without a rebuild.
- JavaScript debugging: Set breakpoints, watch variables, and step through async flows in the actual runtime environment.
- Network monitoring: Verify what data your app sends and receives, including caching behavior and API payloads.
- Accessibility auditing: Expose the accessibility tree and detect skipped headings or missing ARIA roles invisible to visual inspection.
- Client-side privacy: Process files locally, eliminating the data-leak risks tied to server-side file handling.
2026 industry analysis frames developer tooling as a "workshop" that shortens feedback loops and reduces operational toil. When your tools work well, you ship faster and break less.
Table of Contents
- How browser tools improve developer experience and privacy
- Privacy-first browser tools for in-browser file editing
- Key security and privacy principles in browser tool design
- Best practices for integrating browser tools into your workflow
- How Chrome DevTools and Firefox Developer Tools compare
- Practical use cases: debugging and performance in the browser
- Limitations of browser tools for client-side file manipulation
- Maintaining privacy and security while using browser-based tools
- Try Tabtasker's privacy-first browser tools
- Key Takeaways
How browser tools improve developer experience and privacy
The most underrated benefit of browser development tools is that they match how developers actually think. You form a hypothesis about a bug, you test it in the real browser environment, and you get an answer in seconds. No context switching, no server redeploys, no guessing.
Privacy enters the picture the moment you consider what happens when you don't use client-side tools. Upload a sensitive PDF to a random online converter and you have no visibility into where that file goes. Browser tools that process data locally never transmit it, which removes that risk entirely. If you're not paying for the product, you might be the product, and that applies to file-handling services as much as social networks.
- Real runtime observation: Watch actual network traffic, storage usage, and JavaScript state rather than reading logs after the fact.
- Reduced context switching: Stay in the browser instead of bouncing between terminal, editor, and server dashboard.
- Privacy by default: Client-side processing means no file uploads, no accounts, and no server-side data retention.
- Measurable developer experience: Treating tooling as a product with service-level objectives improves both velocity and incident rates.
Pro Tip: Many DevTools features are used regularly, but a smaller subset accounts for the majority of frequent use. Open the Accessibility panel on your next project and you will almost certainly find heading hierarchy issues or missing landmark roles that automated linters missed.
Privacy-first browser tools for in-browser file editing

The clearest example of client-side privacy in practice is a tool that handles your files without ever touching a server. Tabtasker does exactly that: markdown editing, CSV manipulation, PDF editing, image background removal, and audio processing all run directly in your browser, free of charge, with no account required.
That approach matters because centralized online file services carry inherent risks. A breach on their end exposes your data. With Tabtasker, there is no "their end." The file stays on your machine from start to finish.
| Tool / Feature | Function | Offline capable | No upload required | Encryption support |
|---|---|---|---|---|
| Tabtasker PDF editor | PDF editing and annotation | Yes | Yes | Yes |
| Tabtasker markdown editor | Text and markdown editing | Yes | Yes | N/A |
| Tabtasker CSV editor | Spreadsheet and data editing | Yes | Yes | N/A |
| Tabtasker audio editor | Audio processing and conversion | Yes | Yes | N/A |
| Browser DevTools (Elements) | HTML/CSS live editing | Yes | Yes | N/A |
| Browser DevTools (Sources) | JavaScript editing and debugging | Yes | Yes | N/A |
Tabtasker's in-browser code editor guide and its writing on PDF encryption demonstrate the depth of thinking behind its privacy-first design, not just marketing copy.
Key security and privacy principles in browser tool design
A browser tool that claims to protect your privacy needs to back that claim with concrete design decisions. Vague assurances are not enough.
- Client-side processing only: Files must never leave the browser. Any tool that requires an upload to function is not a privacy-first tool, regardless of its privacy policy.
- Minimal permissions: A markdown editor has no business requesting access to your camera or contacts. Scope permissions tightly to the task.
- Encryption for sensitive files: Client-side encryption in PDF editing, for example, protects document contents even if a file is later shared or stored.
- No persistent storage beyond the session: Tools should not retain file data after you close the tab. Session-scoped storage is the correct default.
- Cross-site leak prevention: Well-designed browser tools respect same-origin policies and avoid patterns that expose data to third-party scripts running on the same page.
Best practices for integrating browser tools into your workflow
The developers who get the most out of browser tools treat them as a flight recorder, not a last resort. You open DevTools before you start investigating, not after you've already formed a conclusion.
- Enable source maps: Without them, debugging compiled or minified code means reading archaeology instead of your actual source.
- Preserve network logs: Turn on "Preserve log" in the Network panel when chasing redirect or caching issues so initial requests stay visible across page loads.
- Add stable test IDs: Attributes like
data-testidgive you reliable targeting in both DevTools and automated tests. - Explore beyond the basics: The Accessibility, Service Worker, and Storage panels solve entire categories of bugs that the Elements and Console panels will never surface.
- Pair DevTools with browser automation workflows: Combining DevTools evidence with automation traces gives you a reproducible path to any bug.
Pro Tip: Feed a DevTools stack trace or network waterfall directly into an AI coding assistant. The assistant can propose a fix faster when it has real browser evidence rather than a vague description of the symptom.
How Chrome DevTools and Firefox Developer Tools compare
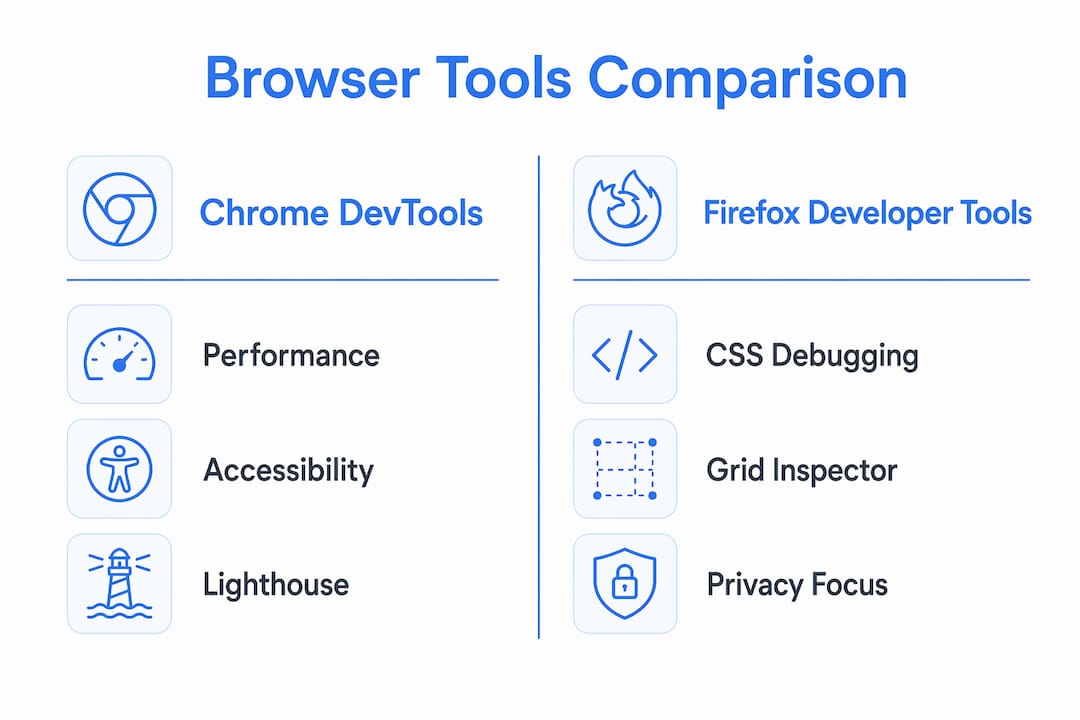
Chrome DevTools and Firefox Developer Tools cover the same core ground: DOM inspection, CSS editing, JavaScript debugging, network monitoring, and storage inspection. The differences are real but targeted.
Chrome DevTools integrates Lighthouse directly for performance and accessibility auditing, and its Performance panel offers a detailed flame chart for runtime profiling. The 2026 version also connects to AI coding agents via a Model Context Protocol server, letting your agent inspect network activity and run Lighthouse checks programmatically.
Firefox Developer Tools has historically led on CSS debugging, with a grid and flexbox inspector that visualizes layout geometry more clearly than Chrome's equivalent. Its Accessibility panel exposes the full accessibility tree with role and state information, which UI experts specifically highlight for detecting structural issues invisible to visual inspection. Firefox also supports attaching DevTools to background browser contexts and remote targets, useful for add-on development and complex debugging scenarios.
Microsoft Edge DevTools, built on the same Chromium base as Chrome, adds its own layer of accessibility tooling and integrates tightly with Microsoft Learn documentation for guided fixes.
Practical use cases: debugging and performance in the browser
The Network panel ends more arguments than any other DevTools feature. When a teammate says "the API is slow" or "the backend returned stale data," the Network panel gives you timestamps, response headers, cache status, and the full payload. You stop debating and start reading evidence.
For layout bugs, the Elements panel lets you toggle CSS declarations on and off live, force element states like :hover or :focus, and inspect computed values to see exactly what the browser applied after cascade resolution. A layout that "looks fine on my machine" but breaks elsewhere usually reveals itself within two minutes of live DOM inspection.
Performance profiling in the Performance panel shows you a frame-by-frame breakdown of rendering, scripting, and painting. If a page feels sluggish, the flame chart will tell you whether the bottleneck is a long JavaScript task, a layout thrash, or a third-party script you didn't write but are paying for in user experience.
Limitations of browser tools for client-side file manipulation
Browser tools are powerful, but they have real constraints worth understanding before you rely on them for production workflows.
Processing large files entirely in the browser can strain memory and CPU, since the work that a server would normally distribute falls entirely on the user's device. A 500MB video file processed client-side will behave very differently on a high-end laptop versus a mid-range phone.
Browser storage limits also apply. IndexedDB and Cache Storage have quotas that vary by browser and available disk space, so tools that cache large files locally may hit limits unexpectedly. Persistent storage requires an explicit permission grant, and browsers can evict non-persistent storage under pressure.
Finally, client-side JavaScript has no access to the file system beyond what the File API and File System Access API expose. Operations that feel trivial on a server, like batch-renaming hundreds of files in a directory, require careful API design to work smoothly in a browser context.
Maintaining privacy and security while using browser-based tools
The browser is a shared environment. Other scripts, extensions, and browser features all operate in the same space, which creates risks even when your tool itself is well-designed.
Audit the extensions installed in your browser regularly. A poorly written extension with broad host permissions can read page content, including files you open in a client-side tool. Use a dedicated browser profile for sensitive file work if you want a clean, extension-free environment.
Check that any browser-based tool you use does not load third-party analytics or tracking scripts that could observe your session. A tool that processes files locally but reports usage data to an external service is not fully private. Tabtasker's privacy-first approach addresses this directly by keeping all processing local with no external dependencies.
Content Security Policy headers on the page hosting your tool also matter. A strong CSP prevents injected scripts from exfiltrating data, adding a meaningful layer of defense even in a browser context.
Try Tabtasker's privacy-first browser tools
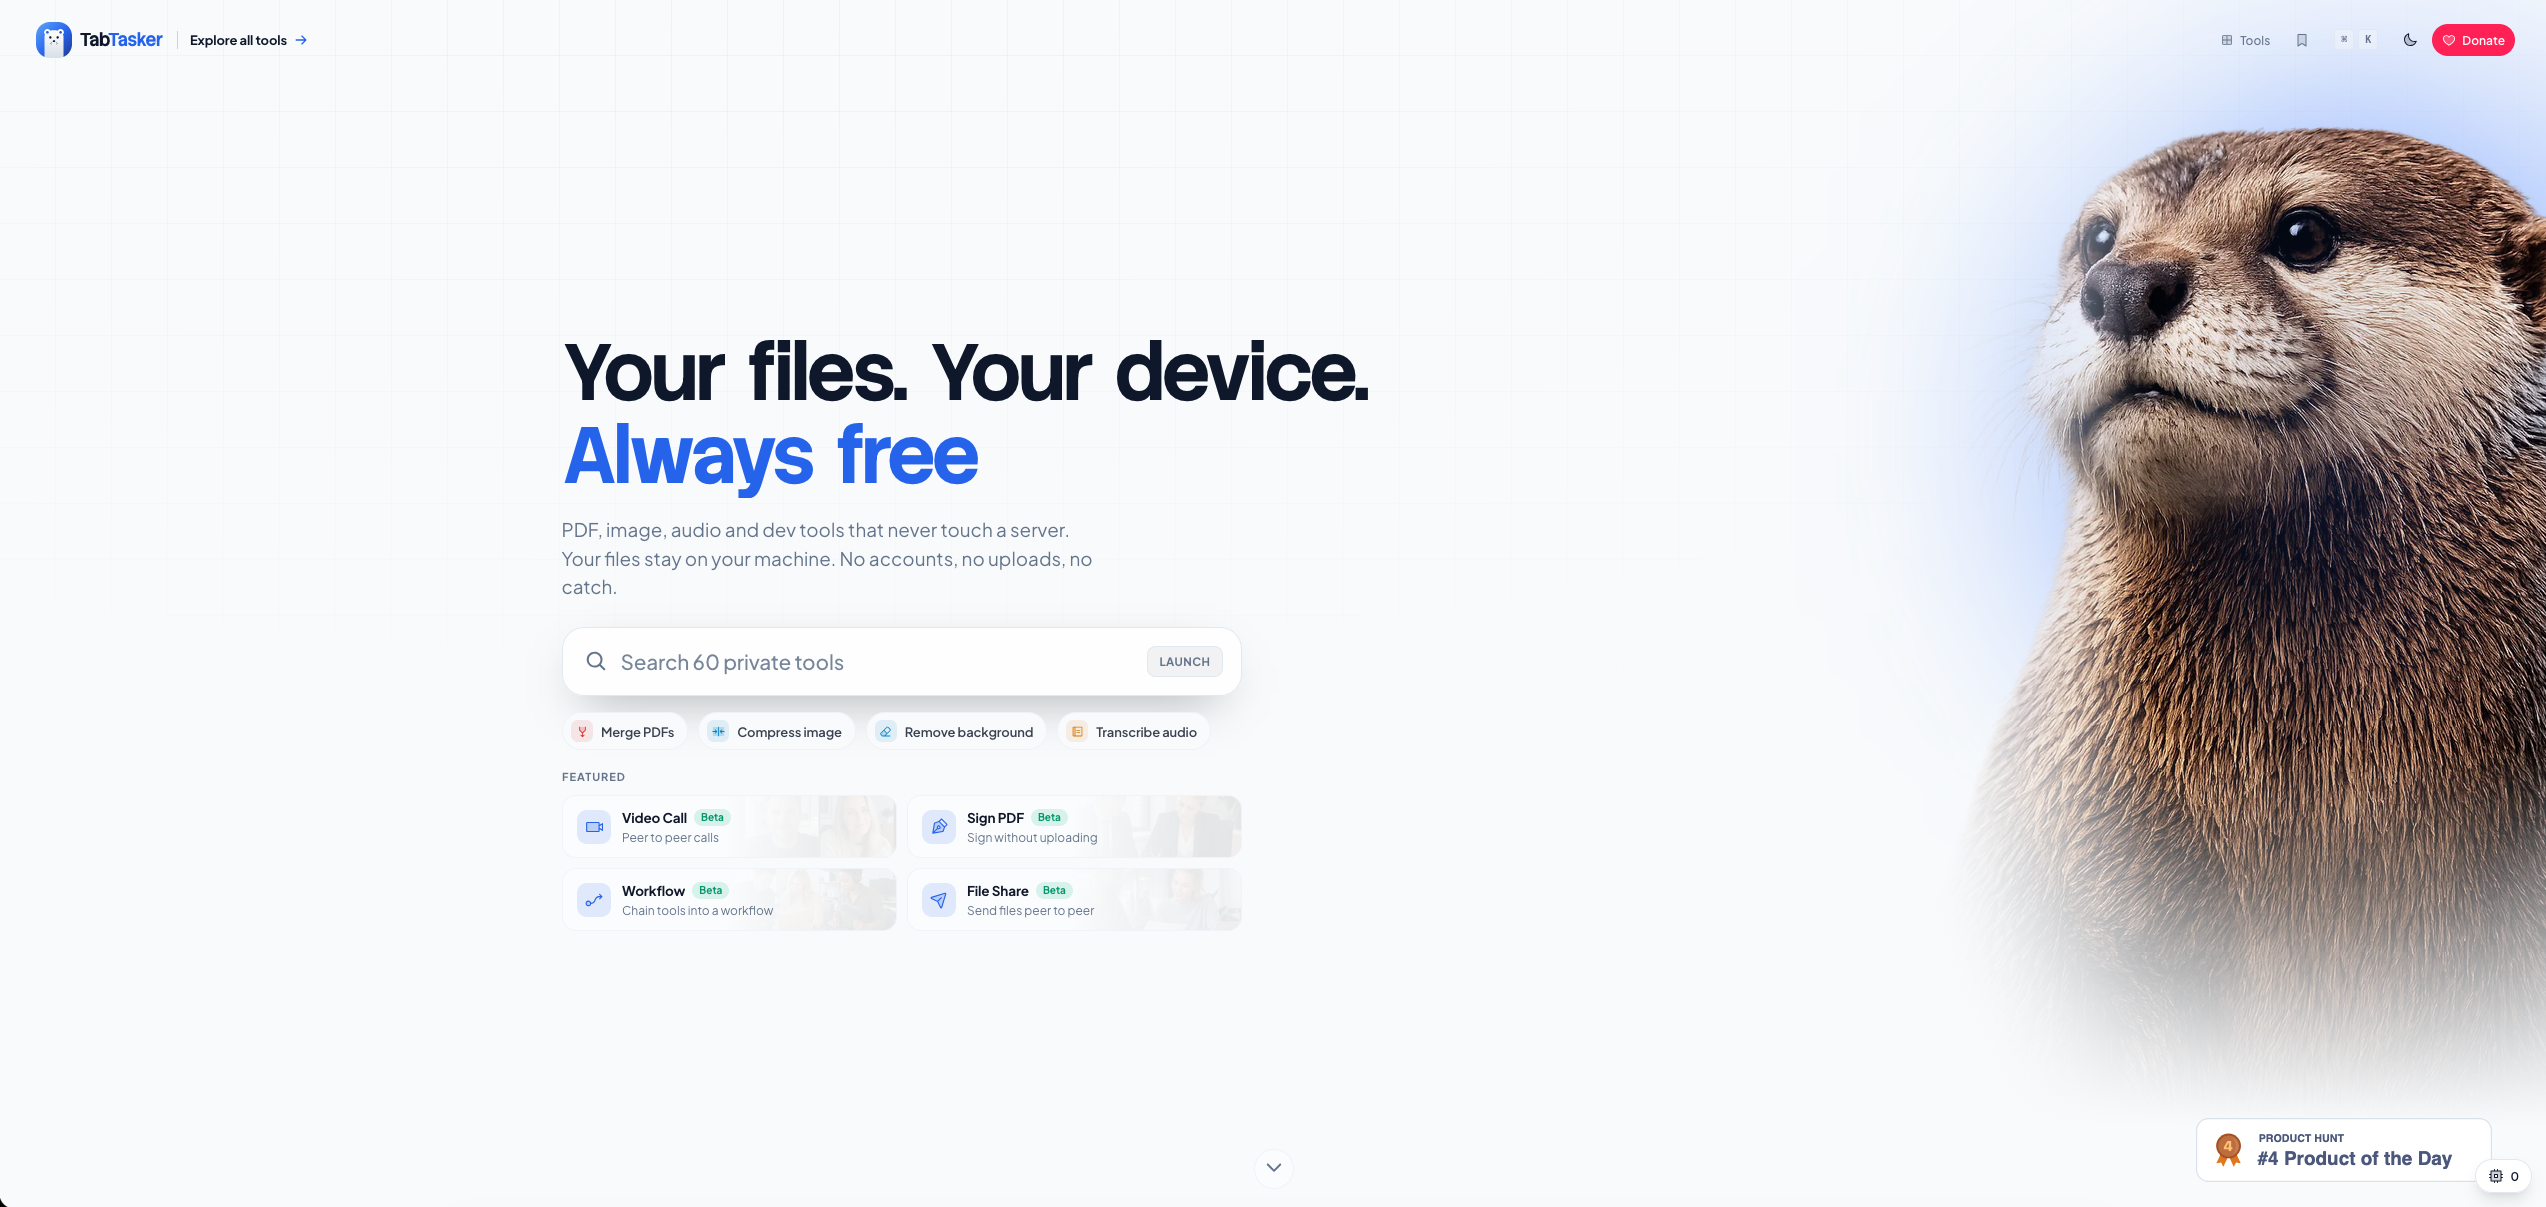
Tabtasker gives you a full suite of offline, client-side tools for file editing and manipulation, with no uploads, no accounts, and no hidden costs. Edit markdown, manipulate CSVs, process audio, and handle PDFs entirely in your browser. Explore the full toolbox and see what private, local-first file editing actually feels like.
Key Takeaways
Browser tools are most valuable when you treat them as a live evidence layer for your actual user environment, not just a debugging fallback.
| Point | Details |
|---|---|
| Client-side privacy is by design | Tools that process files locally eliminate server-side data exposure risks entirely. |
| Most DevTools features go unused | Expanding beyond core panels to Accessibility and Service Worker unlocks whole categories of hidden bugs. |
| Tabtasker processes everything locally | PDF, markdown, CSV, image, and audio tools run offline in-browser with no uploads or accounts required. |
| Source maps and preserved logs accelerate debugging | Enabling both turns DevTools from a guessing game into a fast, repeatable feedback loop. |
| Browser tools have real memory and storage limits | Large client-side file operations can strain device resources and hit browser storage quotas. |